📙1️⃣ Programmatic Visualizations#
🙏 Acknowledgment#
This chapter draws inspiration from a talk by Dr. Sid Chopra, whose insights closely align with the themes I intended to cover here. Several key ideas are adapted, with his kind permission, from that presentation. I’m grateful to Dr. Chopra for generously allowing me to share and expand on them.
👀 Why Visualizations Matter#
If I can’t picture it, I can’t understand it.
Albert Einstein
In scientific research, figures often outlast the text. They are what readers remember, what journalists spotlight, and sometimes even what enters public imagination and pop culture.
The Impact of Visualization#
A powerful example is the widely circulated brain connectivity figure from a psychedelic study by Petri et al.[1] (see Fig. 9). Beyond communicating the core findings, this figure captured the attention of numerous media outlets and became emblematic of the study itself.

Fig. 9 Impact of Psilocybin on brain connectivity as illustrated by by Petri et al.[1].#
Its influence extended well beyond academia, appearing in TEDx talks (in Oxford, Warwick, Aarhus, and Varna) and media stories including Wired, Vox, Mind Medicine Australia, Medium, 7 news, and Business Insider.
This figure became the public face of the study, an iconic example of how visualizations can amplify a paper’s reach and cultural footprint. Yet despite its popularity, the original image remains difficult to reproduce, as standards for sharing visualizations openly were not commonplace in 2014.
Fortunately, the field has evolved. Visualization science now emphasizes openness and reproducibility, supported by a growing ecosystem of tools designed to create sharable, transparent, and programmatically generated figures.
🖥️ Code- vs. GUI-Based Visualizations#
There are two common paradigms for creating scientific visualizations:
GUI-based visualizations: Created through graphical user interfaces, often involving manual adjustments, screenshots, or exports. No coding is required.
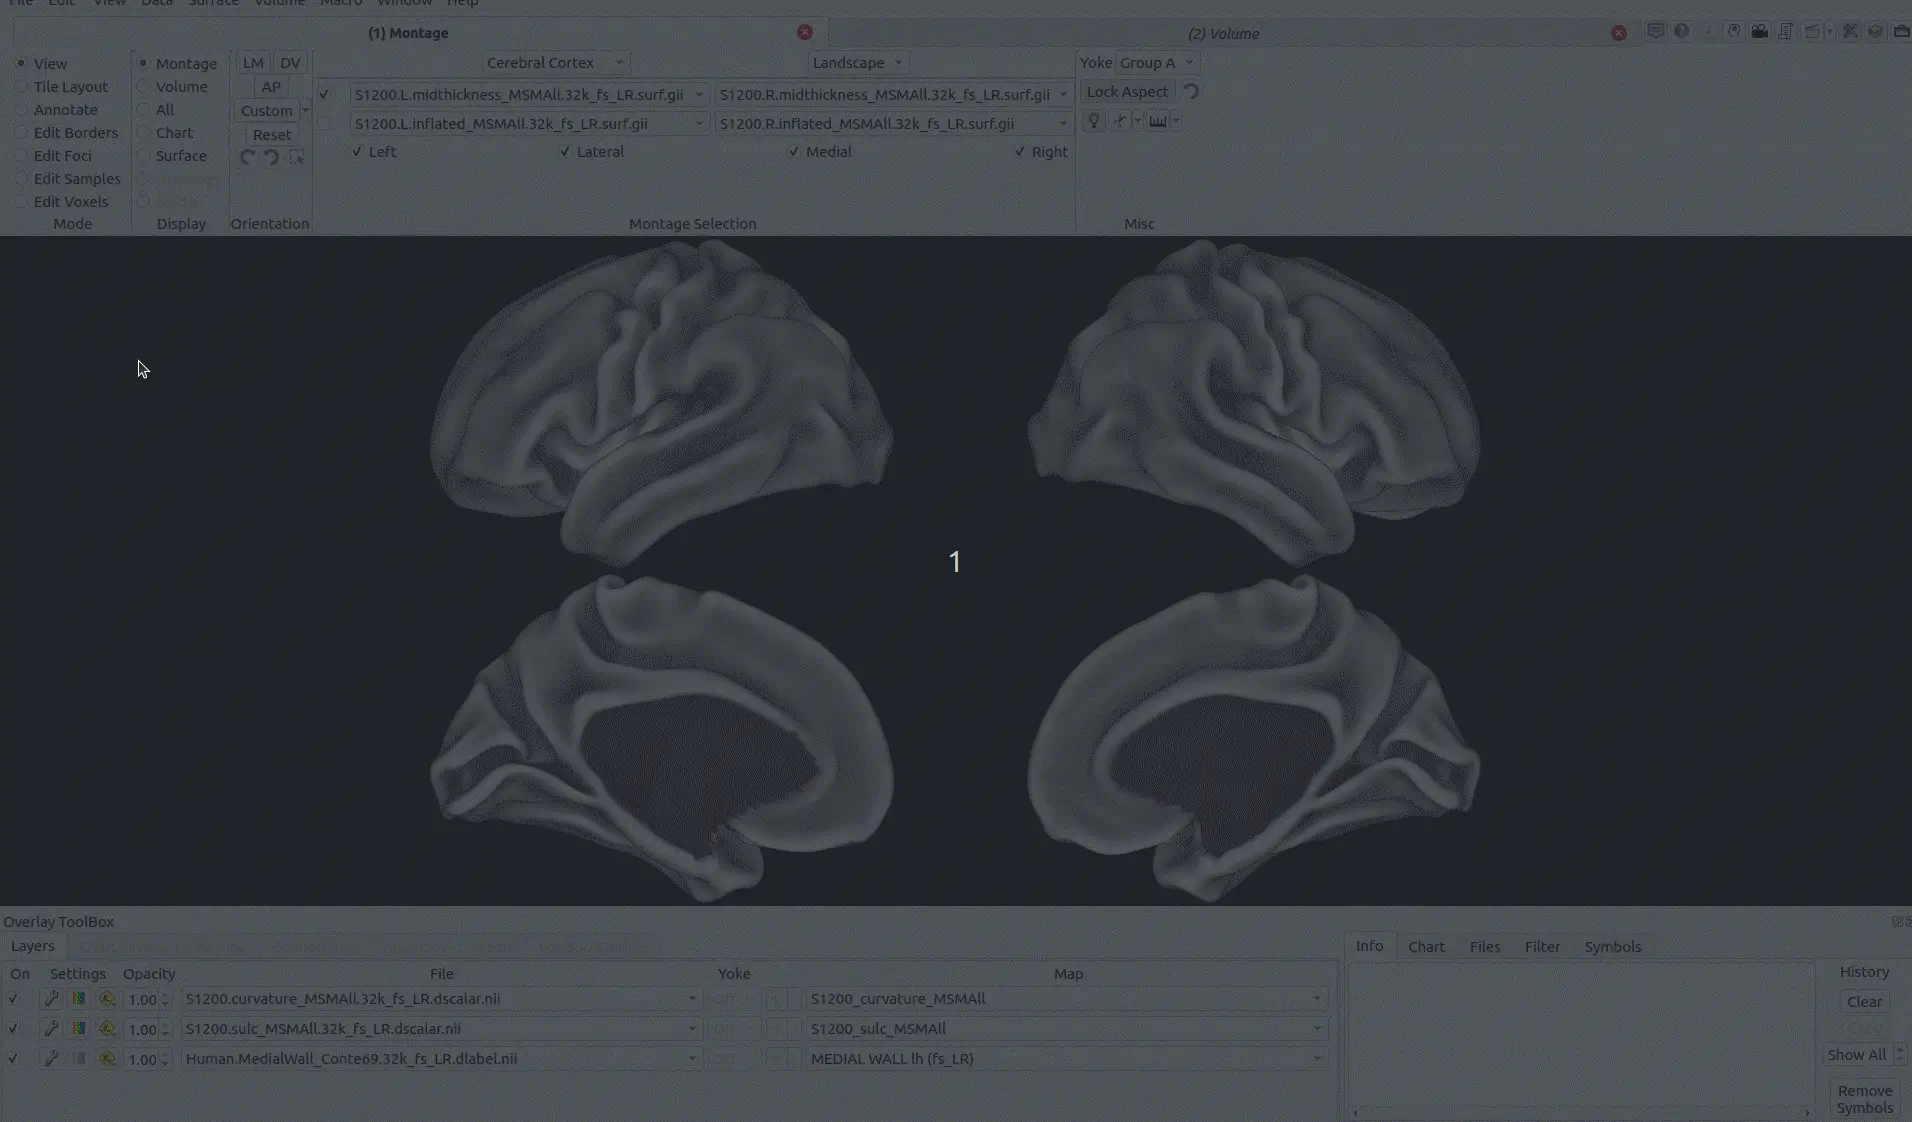
Fig. 10 GUI-based visualization requires no programming, is highly flexible, and is suitable for manual adjustments; however, the figure may not be intuitively reproducible.#
Code-based visualizations: Built using scripts where the figure’s core elements are generated programmatically, with minimal manual adjustments (e.g. for annotations).
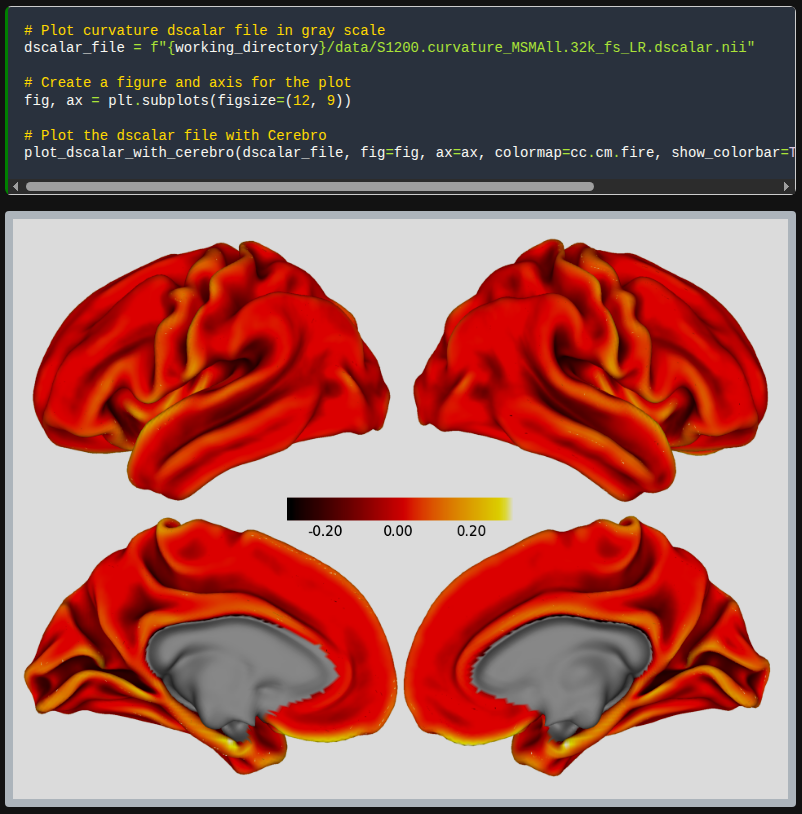
Fig. 11 Code-based visualizations are generated by a reproducible script; while minor adjustments can be manually added to the figure, the main elements of the figure are programmatically generated.#
GUI-based workflows can be fast and intuitive, giving researchers the freedom to tweak visuals until they “look right.” However, this manual process makes it difficult to reproduce the figure, especially if the original settings are undocumented or the utilized tool is not mentioned.
In contrast, code-based visualizations are inherently more reproducible. Since the figure is generated from a script, it can be re-run by anyone, on a different machine, with updated parameters and data. This makes code-based approaches a foundational tool for open, transparent, and reusable science.
✳️ Why Use Programmatic Visualizations?#
Beyond reproducibility, programmatic visualizations offer several powerful advantages:
Flexibility: Seamlessly tweak styles, input data, visualization parameters, or output formats.
Scalability: Efficiently generate dozens or hundreds of plots in a single script; ideal for individual-level reports, making animations, iterative experiments, or sensitivity analyses.
Interactivity: Tools like Plotly, Bokeh, and Altair support interactive plots that can be embedded in notebooks or the web.
Version control: Code-generated figures can be tracked with Git alongside your analysis pipeline.
Automation: Integrate visualizations directly into your analysis pipelines, no manual export needed.
Data integrity: The connection between data and final figure is transparent and auditable, leaving no hidden/unknown steps.
Skill reusability: While the learning curve can be steep initially, the skills and code you develop are reusable across projects, yielding compounding returns.
These strengths make code-based visualization not just a stylistic preference, but a cornerstone of reproducible and transparent research, and an essential skill in any researcher’s toolkit.
👉 What Next?#
In the next section, we’ll introduce a range of tools, libraries, and templates that make code-based visualizations easier and more powerful. We’ll explore how these tools integrate with Jupyter notebooks and neuroimaging file formats, enabling you to share interactive, reproducible, and publication-ready figures as part of your research outputs.